
Update from the NRC
It’s been a while since my last update and I can’t believe I have only a few weeks left in Ottawa at National Research Council Canada (NRC). To make up for the delay, this is going to be a big one!
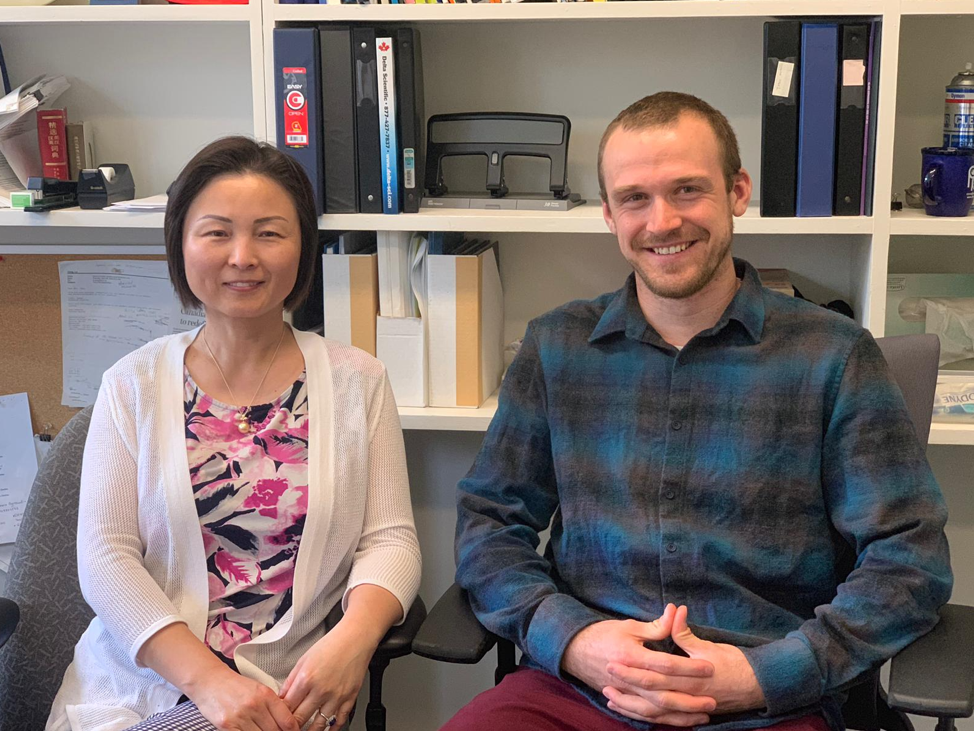
One reason for the delay is that I’m being kept very busy by my NRC supervisor, Dr. Lu Yang (pictured above), who has provided amazing support and shown incredible patience as I often pop by her office multiple times a day to ask random research questions. They often relate to the two projects we are working on during my stay. The first looks to characterize the copper isotopic composition of a pure copper wire (HICU-1) that is in the process of being analyzed by several different methods for it to be accepted as a certified isotopic reference material. Certified isotopic reference materials are essential for the isotope geochemistry community to compare results obtained in different labs around the world. The reason for this is for geochemists to measure the relative isotope ratios of their samples. This is often by consensus to an agreed upon material, and a different material is usually used for each element (aside from oxygen and hydrogen which are reported to standard mean ocean water) because you need something homogeneous that is enriched in the element of interest. Relative ratios are used because they are much easier to determine than absolute isotope amount ratios for a number of reasons that we’ll get into a bit later.
Measuring copper isotopes in geological and biological reference materials
This brings us into the second aspect of my work at NRC that is also essential for comparing results worldwide. In addition to ensuring isotope geochemists are all comparing their results to the same reference materials, it also necessary to measure previously characterized materials that are similar to your samples so that you can be confident your measurements are not only precise, but accurate. This characterizing of different materials makes up a large portion of the work performed by Dr. Yang and her colleagues at NRC. Their mission is to produce a wide variety of materials that are homogeneous, stable, and have elemental abundances or isotopic compositions that are representative of the given material. I have spent the majority of my time at NRC with the task of measuring the copper isotopic compositions of several different biological and geological reference materials that have been previously characterized for trace metal abundances. These include dogfish liver, fish protein, lobster hepatopancreas, human serum, marine sediment, and basalt. To make these measurements possible, we needed to separate copper from the rest of the elements that make up these materials as the instrument used to measure isotope ratios separates isotopes based on their mass over charge ratio. This can cause issues for measuring 63Cu because occasionally, strange compounds form in the plasma that is used to ionize our samples. The plasma is generated from argon (Ar) gas, which is generally inert. However, at operating temperatures of up to 10,000°K (almost double the temperature of the surface of the sun), argon can bond with sodium (Na) to form sodium argide (23Na40Ar+) which has a mass of 63, the same as copper. If sodium is not sufficiently removed from samples prior to analysis, this can be a real problem! So, we adapted a method after Hou et al. (2016) that works as follows:
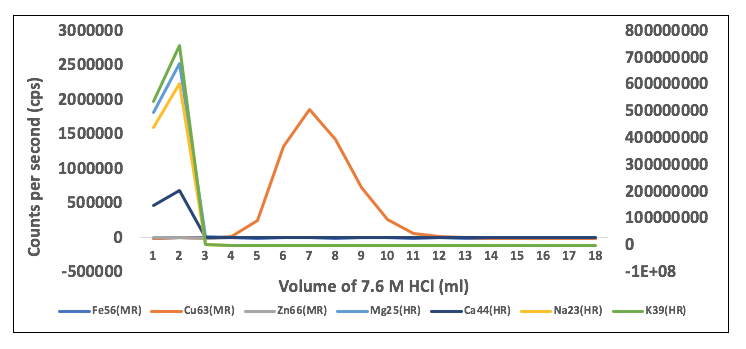
This is a visual representation of how copper is purified from the rest of the major elements. We were able to generate this graph by putting 1 millilitre of hydrochloric acid through our ion exchange column (essentially a tube that contains a resin that has varying affinities for different elements) at a time and collecting and measuring each individual amount. The Y-axis is a semiquantitative way of showing the amount of each element that is contained in an aliquot of acid that passes through the column. Think of the elements all tumbling through the column at varying speeds, so some elements come off early, while others take longer to pass through. This graph shows that in the first three millilitres, the majority of the sodium, magnesium, calcium, and potassium were removed from the column. Beginning with the next millilitre of acid, copper begins to pass through the bottom of the column and you can see it continues to come off for around the next 10 millilitres. In practical terms, how this method works, is that we collect those aliquots of acid where only copper is coming off the column. What happened to the iron and zinc? The resin we used actually has an even higher affinity for those elements than copper, so we are able to remove them by simply keeping them attached to the resin. If we were to continue putting hydrochloric acid through the column, eventually you would see those elements released.
Now that we have our purified copper, we can finally get to doing some measurements! I spoke earlier about how we measure our samples relative to internationally agreed upon reference materials. To do this, we measure samples under the same conditions as the international copper standard, SRM-976 (same copper concentration, purity, and acid concentration). To account for some of the temporal drift in the instrument (instrument sensitivity may increase or decrease over the course of measurement), we use a method called standard-sample bracketing (SSB). This means we measure SRM-976 before and after our sample and compare the sample with the average of the two measured SRM-976 values using the following equation:
δ63CuSRM-976 (‰) = [((63Cu/65Cu)sample)/(63Cu/65Cu)SRM-976 (average))-1)] x 1000
To correct for more irregular changes in instrumental isotopic fractionation during measurement, we combine SSB with an internal normalization isotopic fractionation model. In English, this means we dope our sample and standard with another element as the internal standard (gallium in our case). This method uses the known isotope amount ratio of the copper in the standard to calibrate the isotope amount ratio of the gallium which is then used to calibrate the isotope amount ratio of the copper in the sample.
Measuring absolute isotope amount ratios in HICU-1
Remember how I mentioned it was quite challenging to measure absolute isotope amount ratios? We’ll get into a bit about why that is now. Most isotope fractionation (the way isotopes are distributed) in nature is mass-dependent (the amount of fractionation scales in proportion with the difference in isotope mass). For example, the oxygen isotope ratio 18O/16O of a given material should increase approximately twice more than the ratio 17O/16O due to having a two-times larger mass difference between 18O and 17O over 16O. Occasionally, discrepancies owing to a phenomenon called mass-independent fractionation (MIF) occur in nature, such as in ozone in the troposphere, which has almost the same 18O/16O and 17O/16O ratio. This unexpected behaviour is also observed for many elements in multiple-collector inductively coupled plasma mass spectrometers (MC-ICP-MS), the main instrument isotope geochemists use to determine isotope ratios. For this reason, you are unable to obtain accurate isotope amount ratios using traditional mass-dependent fractionation models. Therefore, we are using a method called the regression isotopic fractionation correction model, which Dr. Yang has nicely summarized in a recent review paper (Yang et al., 2018).
Traditional mass-dependent fractionation models function under the assumption that isotope fractionation is equal for both the analyte and the standard that is measured before and after every sample measurement (SSB that we mentioned earlier). This is fine for relative ratio measurements where samples and standards are matrix-matched, but not absolute. To work around this obstacle, the temporal isotopic fractionation drift occurring in MC-ICP-MS can be taken advantage of using a primary isotope reference material of the same or another element (one that has been gravimetrically defined). Crucial to this model is the correlated drift of two isotope amount ratios during measurement, and the true isotope amount ratio is directly linked to its measured ratio by a correction factor. This produces a measurement model that doesn’t rely on the assumption of identical isotopic fractionation for different isotope pairs. One challenge we’ve experienced with this method is that we’ve found large discrepancies between the 63Cu/65Cu ratio and atomic mass determined using two different primary isotopic reference materials (nickel and gallium) to correct copper isotope amount ratios. One possible reason for this is that these primary reference materials were characterized decades ago. It is possible that these measurements need to be re-determined using modern equipment that is both more accurate and precise. We certainly have our work cut out for us.
I hope anyone reading this isn’t bored to tears, and I’m incredibly sorry if that’s the case! If you’ve made it this far, thank you. I’ve tried my best to strike a balance between being informative and not insulting your intelligence. I hope that I’ve conveyed in a reasonably understandable way some concrete information on what it takes to perform this type of research and some of the associated difficulties. If you have any questions or criticisms about what I’ve detailed here, please don’t hesitate to get in touch. I’d be happy to help in any way I can.
This blog post will be my last update while on the Kimberley Foundation’s Hugh Morris Experiential Learning Fellowship. It’s amazing to think that I began this journey almost exactly one year ago in Japan at Osaka University and Tokyo Metropolitan University. The journey doesn’t end here, though. I’ve been fortunate enough to secure funding to allow me to return to Imperial College London for three months from July to October to analyze some of my own research samples using the same techniques I learned this past Fall. I’m excited to work with Mark and Rebekah again and finally meet Dr. Fiona Larner, whose 2015 paper helped inspire my interest in the applications of isotope geochemistry in human health. Thank you to Sue Roppel and the Kimberley Foundation Board for this incredible opportunity you’ve given me. I’ve grown so much over this past year and am proud to have followed in the footsteps Hugh Morris’ original journey of learning through gaining hands-on experience.
Kaj